Designing a Fair Test in Under an Hour
Designing tests that are fair, focused, and finished in 60 minutes is possible. Here is a five-block process that protects your evening and your students.
How to make a table of specification for a quarterly or term exam: allocate items by teaching time, spread them across cognitive levels, and download an Excel template with a complete Grade 7 science sample.
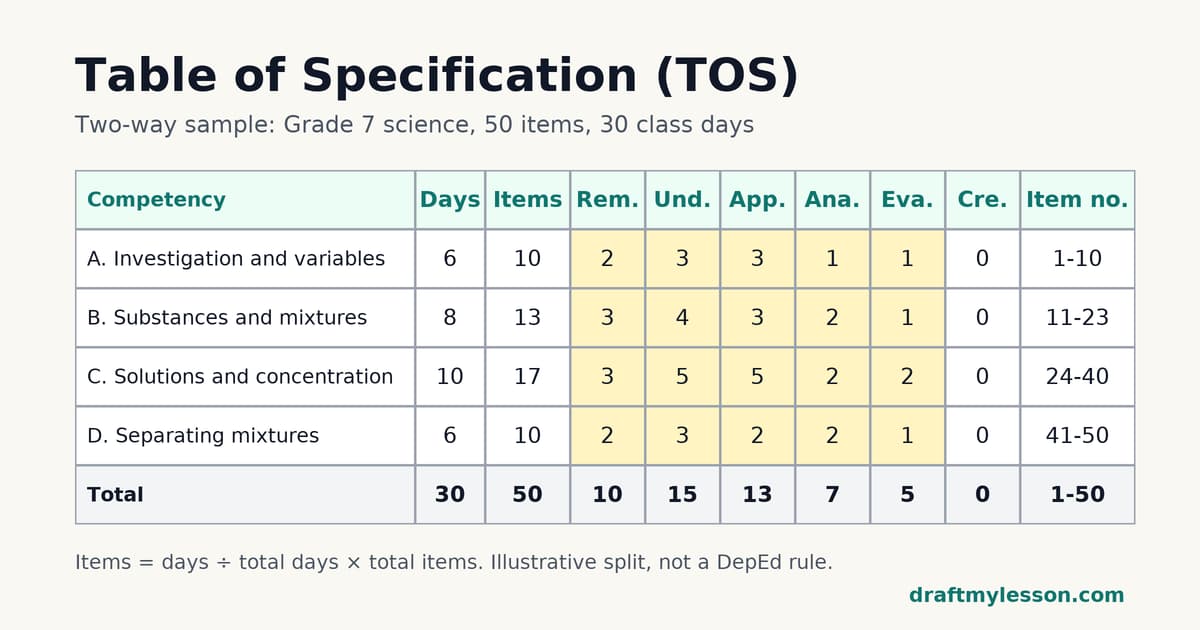
The short answer: A table of specification (TOS) is the blueprint of a test. It lists the competencies you taught, how long you spent on each, how many items each one gets, and at which cognitive level those items are written. The usual rule is simple: number of items = (days spent on the competency ÷ total days) × total items. A two-way TOS then spreads those items across cognitive levels such as remembering, understanding and applying.
Download the files used on this page. No account is needed.
Key takeaways
- Weight each competency by the time you actually spent teaching it, not by how hard it feels or how much you like it.
- A one-way TOS gives items per competency. A two-way TOS adds the cognitive level of every item.
- DepEd Order No. 8, s. 2015 asks for test items spread across cognitive levels. It does not fix one national percentage per level, so the split on this page is an example, not a rule.
- Division memoranda cite DepEd Order No. 15, s. 2026, which is reported to revise the assessment rules. If it, or your division, sets a split or a number of items, follow that instead.
- Check your school or division first: many divisions share their own TOS format or a TOS for the term examination.
A table of specification, also called a test blueprint, is a planning grid you fill before you write the test questions. Each row is a learning competency. The columns record the teaching time, the share of the test that competency deserves, the number of items, and where those items sit in the test paper (the item placement).
It solves two common problems. First, it stops a test from over-sampling the topic you taught last week and forgetting the one you taught at the start of the term. Second, it shows at a glance whether every question is a recall question. That is what test specialists call content validity: the test measures what was taught, in proportion to how it was taught.
There are two common formats:
| Format | What it shows | When to use it |
|---|---|---|
| One-way TOS | Competencies, days or hours, percentage, number of items, item placement | Short quizzes and summative tests where all items are at a similar level |
| Two-way TOS | Everything in the one-way TOS, plus the number of items at each cognitive level | Quarterly, term and periodical examinations, and any test that should go beyond recall |
You may also see a “three-way” TOS, which adds a third dimension such as item type (multiple choice, matching, short answer) or difficulty. It follows the same logic, and most teachers only need the two-way version.

The classroom assessment policy that introduced the K to 12 grading components, DepEd Order No. 8, s. 2015, describes six cognitive process dimensions adapted from Anderson and Krathwohl (2001): remembering, understanding, applying, analyzing, evaluating and creating. On written work, it says: “It is strongly recommended that items in long quizzes/tests be distributed across the Cognitive Process Dimensions so that all are adequately covered.”
That is the principle a two-way TOS puts into practice. DepEd Order No. 8, s. 2015 does not give a required percentage for each level, and it does not attach a national TOS form.
For School Year 2026-2027, at least one division memorandum on term examinations cites DepEd Order No. 15, s. 2026, for example the Schools Division Office of Angeles City memorandum of 10 August 2026. It shares a Term 1 table of specifications and states that it “is intended to serve as a guide and may be revised or modified, as necessary, based on the needs, abilities, and circumstances of the learners.”
Division memoranda cite DepEd Order No. 15, s. 2026, which is reported to revise the rules on classroom assessment. As of 23 October 2026 we could not read its official text, so this page does not describe what it requires. If it sets a split across cognitive levels or a number of items per test, follow it rather than the example on this page. Read the current order and any TOS your division issues before you finalize your own test. If your school or division gives you a format, use it. The method below fills any format.
Sources checked on 23 October 2026: DepEd Order No. 8, s. 2015 (full text, archived copy of the official PDF) and the SDO Angeles City memorandum of 10 August 2026. The official text of DepEd Order No. 15, s. 2026 could not be accessed on that date.
The worked example is a Grade 7 science term examination of 50 items covering four competencies taught over 30 class days. The competencies are written in plain language for this example. In your own TOS, copy the exact competency statements, and codes if your school uses them, from your curriculum guide.
Write one row per competency covered since the last test. Leave out anything you planned but did not teach. If a competency was only introduced, decide whether it belongs in this test or the next one.
| Competency (illustrative) | |
|---|---|
| A | Describe the steps of a scientific investigation and identify its variables |
| B | Distinguish pure substances from mixtures |
| C | Describe solutions and express their concentration |
| D | Choose a suitable method to separate a mixture |
Use your daily lesson log or class record to count the days (or hours) you spent on each competency. In the example: A took 6 days, B took 8 days, C took 10 days and D took 6 days, for a total of 30 days. If class periods have different lengths, count minutes or hours instead of days. Use the same unit for every row.
For each row, divide the days by the total, then multiply by the number of items in the test:
| Competency | Days | % of teaching time | Days ÷ 30 × 50 | Items |
|---|---|---|---|---|
| A | 6 | 20.0% | 10.00 | 10 |
| B | 8 | 26.7% | 13.33 | 13 |
| C | 10 | 33.3% | 16.67 | 17 |
| D | 6 | 20.0% | 10.00 | 10 |
| Total | 30 | 100% | 50.00 | 50 |
Rounding is where most TOS errors come from. Round each result to the nearest whole number, then add the column. In this example the rounded column already adds up to 50 (16.67 rounds to 17 and 13.33 rounds to 13), so nothing needs to change.
When it does not add up, change one row by one item. Take three competencies taught 4 days each in a 50-item test: each gets 4 ÷ 12 × 50 = 16.67, which rounds to 17, and 17 + 17 + 17 = 51. That is one item too many, so bring one row down to 16 (17 + 17 + 16 = 50). When rows are tied like this, take the item from the competency you consider least central. Never let the rounded column drift away from the total number of items.
Decide what share of the test goes to each cognitive level, then split each row. The split below is illustrative: it is one reasonable choice for a Grade 7 written exam, not a DepEd requirement. Change it to match your learners, your competencies and any guidance from your school or division.
| Level | Share used in this example | Items out of 50 |
|---|---|---|
| Remembering | 20% | 10 |
| Understanding | 30% | 15 |
| Applying | 26% | 13 |
| Analyzing | 14% | 7 |
| Evaluating | 10% | 5 |
| Creating | 0% | 0 |
Creating gets no items here because a pen-and-paper exam is rarely the best evidence for it. DepEd Order No. 8, s. 2015 describes performance tasks as the component where learners “may create or innovate products”, so creating is usually assessed there. If your exam includes an essay or a design question, give creating a few items and take them from another level.
To write the items at the right level, keep a verb list beside you. Our Bloom’s taxonomy verbs chart gives verbs and question stems for each of the six levels.
Fill each cell so that every row adds up to its item count from step 3 and every column adds up to the level total from step 4. Then assign item numbers. Grouping items by competency, as below, makes the item analysis after the test much easier.
Finally, check three things: the grand total equals the number of items, no competency you taught has zero items, and no single level carries most of the test unless you meant it to.
| Competency | Days | % | Items | Remembering | Understanding | Applying | Analyzing | Evaluating | Creating | Item placement |
|---|---|---|---|---|---|---|---|---|---|---|
| A. Scientific investigation and variables | 6 | 20.0% | 10 | 2 (1-2) | 3 (3-5) | 3 (6-8) | 1 (9) | 1 (10) | 0 | 1-10 |
| B. Pure substances and mixtures | 8 | 26.7% | 13 | 3 (11-13) | 4 (14-17) | 3 (18-20) | 2 (21-22) | 1 (23) | 0 | 11-23 |
| C. Solutions and concentration | 10 | 33.3% | 17 | 3 (24-26) | 5 (27-31) | 5 (32-36) | 2 (37-38) | 2 (39-40) | 0 | 24-40 |
| D. Separating mixtures | 6 | 20.0% | 10 | 2 (41-42) | 3 (43-45) | 2 (46-47) | 2 (48-49) | 1 (50) | 0 | 41-50 |
| Total | 30 | 100% | 50 | 10 | 15 | 13 | 7 | 5 | 0 | 1-50 |
Each level cell shows the number of items, then their item numbers in brackets: for example, competency C at the applying level is items 32-36. Every row adds up to its item count (10, 13, 17 and 10) and every column to its level total (10, 15, 13, 7, 5 and 0). The Word and PDF files show the same sample.
Here is what one item per level can look like for competency C (solutions and concentration):
The Excel template has two sheets.
The file opens in Excel, Google Sheets (File, then Import) and LibreOffice Calc, which calculate the formulas when the file opens. The formulas only use basic functions (SUM, ROUND, IF and OR), so they also work in the Excel and Google Sheets phone apps. A quick preview, for example in an email or a file viewer, may show the calculated cells empty: open the file in a spreadsheet app instead.

Once the grid is set, you know exactly how many items to write for each competency and level. The Draft My Lesson worksheet generator can draft multiple choice items, quick quizzes and summative assessments from your topic, grade and difficulty, with an answer key, in a format you can edit and export to Word or PDF. It does not build the TOS for you and it does not produce an official DepEd test form: use your TOS to choose what to ask for, then review every item against it. Your free account includes two complete lessons with access to the exercise formats. Draft the items for one competency.
What is a table of specification in assessment?
It is a test blueprint: a grid that links each learning competency to the time spent teaching it, the number of test items it gets, the cognitive level of those items and their place in the test paper. It is written before the questions, so that the test samples what was taught in the right proportion.
What is the difference between a one-way and a two-way table of specification?
A one-way TOS shows competencies, teaching time, percentage, number of items and item placement. A two-way TOS adds a second dimension: how many of each competency’s items are written at each cognitive level, such as remembering, understanding, applying, analyzing, evaluating and creating.
How do you compute the number of items per competency?
Divide the days (or hours) spent on the competency by the total days, then multiply by the total number of items. For example, 8 days out of 30 in a 50-item test gives 8 ÷ 30 × 50 = 13.33, rounded to 13. After rounding every row, make sure the column still adds up to the total.
How do I make a TOS for 30 items?
Use the same formula with 30 as the total number of items. With the teaching time from this page (6, 8, 10 and 6 days out of 30), each competency gets days ÷ 30 × 30 items: 6, 8, 10 and 6 items, which already adds up to 30. Then split each row across the cognitive levels and number the items from 1 to 30. The same steps work for an elementary quiz and a high school term exam.
Is a TOS required for summative tests?
It depends on your school and division. DepEd Order No. 8, s. 2015 recommends spreading the items of long quizzes and tests across the cognitive process dimensions, which is what a TOS records, but the order does not require a TOS or attach a TOS form. The rules of DepEd Order No. 15, s. 2026 could not be checked here, so ask your school head or check your division memorandum. Even when it is not required, a one-way TOS takes a few minutes and keeps a short test balanced.
Is there an official DepEd table of specification template?
DepEd Order No. 8, s. 2015 asks that test items be distributed across the cognitive process dimensions, but it does not attach a single national TOS form. DepEd Order No. 15, s. 2026 is reported to revise the assessment rules; we could not read its official text as of 23 October 2026, so check whether it or your division sets a format. Many schools and divisions provide their own format, and some divisions share a TOS for the term examination as a guide. Ask your school head or subject coordinator which format to use.
What percentage should go to easy, average and difficult items?
DepEd Order No. 8, s. 2015 sets no single rule. Some schools group the six cognitive levels into easy, average and difficult and set their own percentages. If DepEd Order No. 15, s. 2026 or your division sets a split, follow it. If there is none, start from a split like the example on this page and adjust it to your learners.
Is this the same as the PRC table of specifications for the LET?
No. LET reviewers also talk about a “TOS”, meaning the coverage of the licensure exam. This page is about the TOS a teacher prepares for a classroom test.
Blog